Create a distilled model with a different adjustment to the teacher
model distillation
Published
April 24, 2022
Distillation is the process of training a small model on a task with the help of a larger, trained, model. The small model is referred to as the student and the large model is the teacher. Teaching the student involves the regular process of measuring accuracy and teaching the student to match the distribution of predictions from the teacher. Matching the distribution shows the student what other classes are similar to the correct class, and guides it to the correct weights in a more holistic way.
The teacher is large and well trained and that means that the teacher predicts the correct class very strongly. For the teacher to add value to the training we must alter this output to show the class distribution more. The way we do that is to alter the outputs, boosting the low probability classes and reducing the high probability class(es). Probability alteration is controlled using a parameter called temperature.
When trying out distillation I was concerned that the temperature parameter was not shaping the teacher output in an appropriate way. In the last blog post I investiged changing the algorithm for temperature to better reflect the underlying probability distribution. This worked but the original temperature algorithm performed better and was faster.
The measurement of loss against the teacher output is done using KL Divergence. When I have wanted to measure the similarity of two distributions I have used Cosine Similarity. In this post I investigate changing the distillation process to use Cosine Similarity Loss.
What is the difference?
Kullback–Leibler divergence is a statistical distance: a measure of how one probability distribution Q is different from a second, reference probability distribution P. wikipedia
Cosine similarity is a measure of similarity between two sequences of numbers. wikipedia
These sound extremely similar.
I have more experience with cosine similarity. The cosine similarity measures the angle between two vectors and produces a value between 1 (same direction) and -1 (opposite direction). It does not measure the magnitude.
When using Cosine Similarity as a training metric you also indicate if the two vectors should be considered the same or different. It is frequently used to train semantic systems where you can say that two input sequences have the same meaning (1) or different meaning (-1). The additional argument allows you to force two inputs to be different, like two utterances which have different meanings.
For KL Divergence it is just for making sequences match. I’m currently thinking of it like training a classifier with cross entropy, except that the correct output is a specific known distribution instead of a single class.
This does suggest to me that KL Divergence is the better metric. I do think that Cosine Similiarty can be used, we just are not using it fully.
Cosine Teacher Loss
I can just smash this out now. The cosine loss is just the student outputs measured against the teacher outputs. It’s important to realise that this measures the angle and not the magnitude, so this can change how well the student learns the decision boundaries from the teacher.
Given that the teacher will produce strongly confident predictions you would normally scale the model outputs in some way.
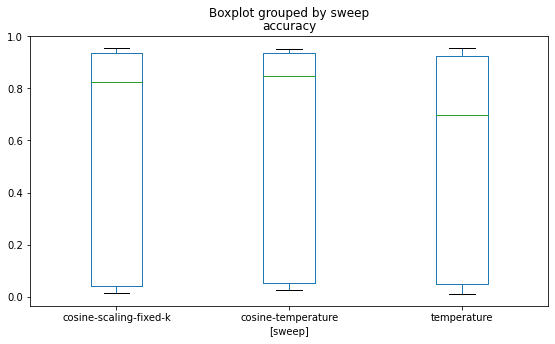
The Cosine Similarity version of Scaling has slightly edged out both the original temperature approach used in the workshop and the Cosine Similarity temperature version. Is this difference significant?
This is the chance for me to do a significance test!
I’m probably going to choose the wrong test, and interpret it in the wrong way. I have found the T-Test which is described as:
Suppose we observe two independent samples, e.g. flower petal lengths, and we are considering whether the two samples were drawn from the same population (e.g. the same species of flower or two species with similar petal characteristics) or two different populations.
The t-test quantifies the difference between the arithmetic means of the two samples. The p-value quantifies the probability of observing as or more extreme values assuming the null hypothesis, that the samples are drawn from populations with the same population means, is true. A p-value larger than a chosen threshold (e.g. 5% or 1%) indicates that our observation is not so unlikely to have occurred by chance. Therefore, we do not reject the null hypothesis of equal population means. If the p-value is smaller than our threshold, then we have evidence against the null hypothesis of equal population means.
Given the accuracy scores from the Cosine Similarity version of Scaling and KL Divergence version of Temperature, can we say that there is a significant difference?
Code
from scipy.stats import ttest_indttest_ind( results[results.sweep =="cosine-scaling-fixed-k"].accuracy, results[results.sweep =="temperature"].accuracy, alternative="greater",)
I’ve chosen to test if the Cosine Scaling runs are more accurate than the Temperature runs.
The p-value here does not indicate a strong difference as it does not reach the 5% threshold. The number of evaluations is great enough that this test should be valid. Really, the uncertainty comes from if this is the right test to use at all. Remember that the hyperparameters for these two runs were selected using the baesian method so it is not a random distribution across the two techniques.
Anyway that was fun. Doing this was more a way to explore distillation by exploring the teacher student training.